¶ Getting started with reports
This guide will help you get started by building a report and then publishing data to it.
For more information about reporting, please view the topic page: Reports
¶ Scenario
The following guide will walk you through creating a ficticious temperature report that collects a temperature and customer field from each device, and then generates several aggregations.
¶ Creating a report
Follow the steps below to create a new report.
¶ Creating a new report
- Navigate to
Reportsin the navigation menu. - Click
New report. - Name the report
Temperature Report. - Set the key value to
temperature. This value is used when publishing data to a report from triggers.
¶ Adding fields to the report
Follow the steps below to add two fields to the report, temperature and customer.
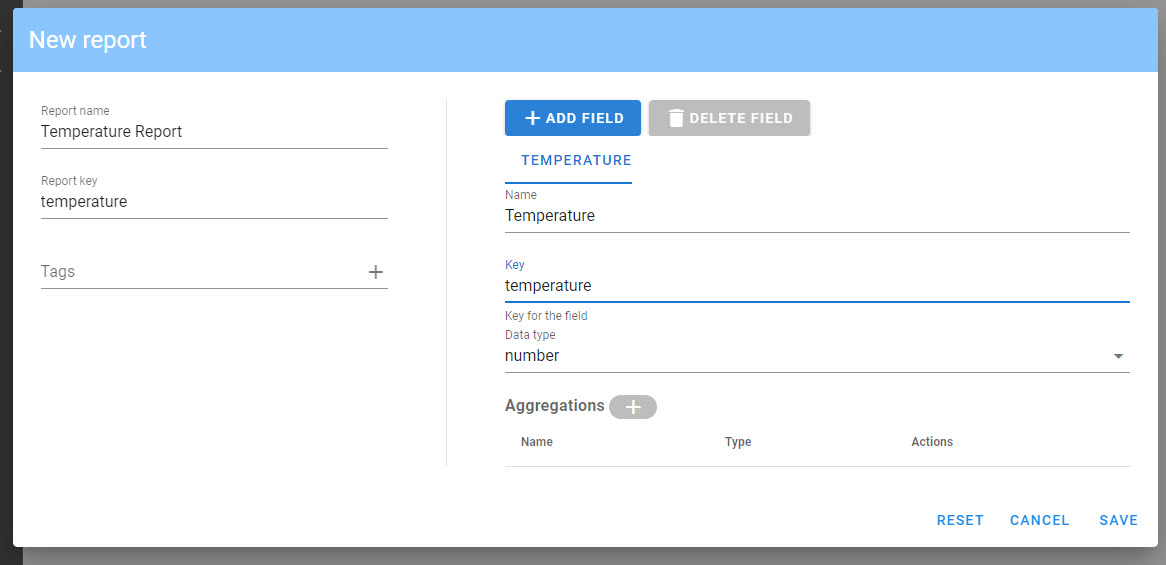
- Add the temperature field
a. Click+ Add Field.
b. Set thenametoTemperature.
c. Set thekeytotemperature.
d. Set thedata typetonumber. - Add the customer field
a. Click+ Add Field.
b. Set thenametoCustomer.
c. Set thekeytocustomer.
d. Set thedata typetocustomer.
¶ Adding aggregations to the report
Follow the steps below to add two aggregations to the report.
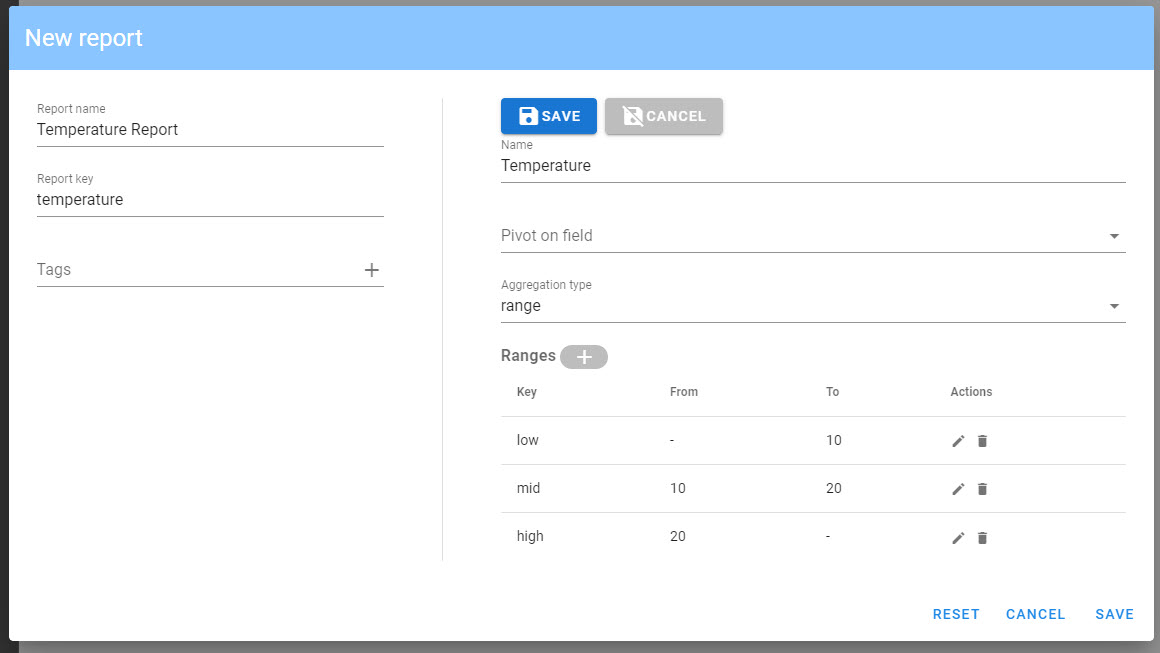
- Add the
Temperatureaggregation. This will be a range aggregation to create multiple buckets depending on the value of the field.
a. Click on theTemperaturetab to select the field.
b. click the+button next to Aggregations to add a new aggregation.
c. Set thenametoTemperature.
d. LeavePivot on fieldblank.
e. Set Aggregation type torangesince this is a numeric field.
f. Add a range titledlowand settoto10, leavefromblank to indicate any smaller value.
g. Add a range titledmidand setfromto10andtoto20.
h. Add a range titledhighand setfromto20, leavetoblank to indicate any larger value.
i. ClickSaveto save the aggregation. - Add the
Devices by Customeraggregation, this will be a terms aggregation to count records with distinct values.
a. Click on theCustomertab to select the field.
b. click the+button next to Aggregations to add a new aggregation.
c. Set thenametoDevices by Customer.
d. LeavePivot on fieldblank.
e. Set Aggregation type totermssince this is a string field.
f. ClickSaveto save the aggregation. - Add the
Temperature by Customeraggregation. This will be a range aggregation to create multiple buckets depending on the value of the field, but in addition, the groups will be sub-grouped by customer.
a. Click on theTemperaturetab to select the field.
b. click the+button next to Aggregations to add a new aggregation.
c. Set thenametoTemperature by Customer.
d. SetPivot on fieldtoCustomer.
e. Set Aggregation type torangesince this is a numeric field.
f. Add a range titledlowand settoto10, leavefromblank to indicate any smaller value.
g. Add a range titledmidand setfromto10andtoto20.
h. Add a range titledhighand setfromto20, leavetoblank to indicate any larger value.
i. ClickSaveto save the aggregation
¶ Publishing to a report
Reports are published from triggers. Below we will create a sample trigger to publish data to the report.
¶ Create the trigger
- Navigate to
Triggers. - Click
New trigger. - Set the
NametoPopulate Report. - Set the
Event typetoGeneric. - Set the the
Filter generic keyfield toreport-gen. - Set the
Generic samplefield to{}. - Enter the following for the trigger script:
report.publish('temperature','sensor1',event.ts,{name: 'Sensor1', values: { temperature: random.double(0.0, 30.0), customer: 'customer1'}})
report.publish('temperature','sensor2',event.ts,{name: 'Sensor2', values: { temperature: random.double(0.0, 30.0), customer: 'customer1'}})
report.publish('temperature','sensor3',event.ts,{name: 'Sensor3', values: { temperature: random.double(0.0, 30.0), customer: 'customer1'}})
report.publish('temperature','sensor4',event.ts,{name: 'Sensor4', values: { temperature: random.double(0.0, 30.0), customer: 'customer2'}})
report.publish('temperature','sensor5',event.ts,{name: 'Sensor5', values: { temperature: random.double(0.0, 30.0), customer: 'customer2'}})
report.publish('temperature','sensor6',event.ts,{name: 'Sensor6', values: { temperature: random.double(0.0, 30.0), customer: 'customer3'}})
report.publish('temperature','sensor7',event.ts,{name: 'Sensor7', values: { temperature: random.double(0.0, 30.0), customer: 'customer3'}})
report.publish('temperature','sensor8',event.ts,{name: 'Sensor8', values: { temperature: random.double(0.0, 30.0), customer: 'customer3'}})
- Click
Save and close.
¶ Start the trigger
- Navigate to the Trigger list.
- Find the
Populate Reporttrigger and click thetriangleicon to start the trigger. - Click the
running manicon to execute the trigger. - Click the
Executebutton in the popup. - Verify that the trigger has been executed without an error.
¶ Exploring the report
- Navigate to
Reports. - Expand the
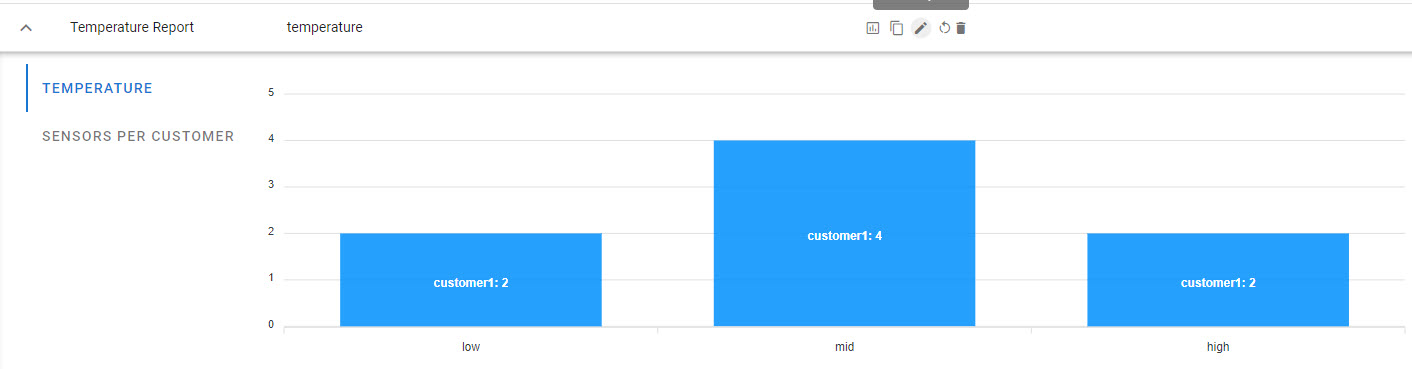
Temperature Report. - First, you will see the
Temperatureaggregation, with a rollup of data by range bucket.
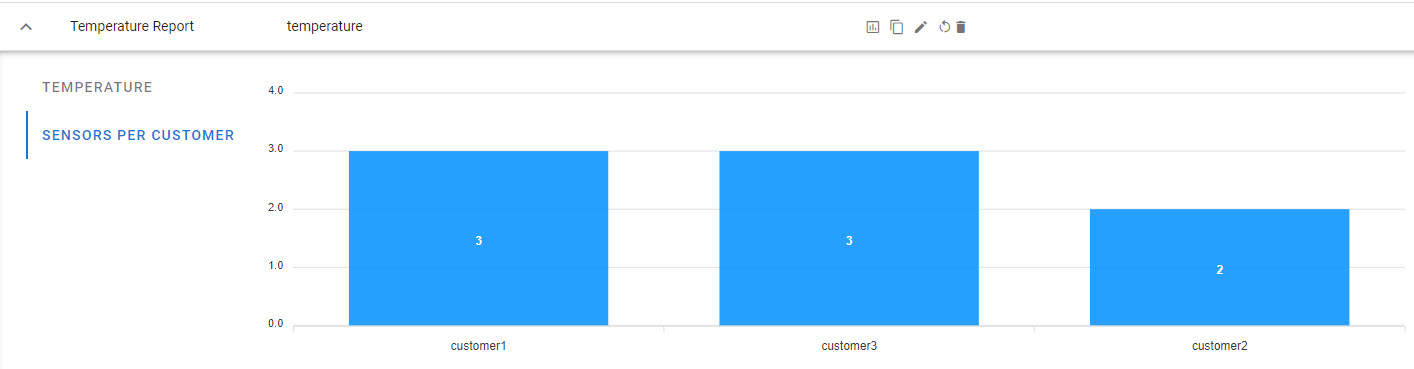
- Second, you will see the
Devices by Customeraggregation, this shows the terms aggregation with number of entries for each customer.
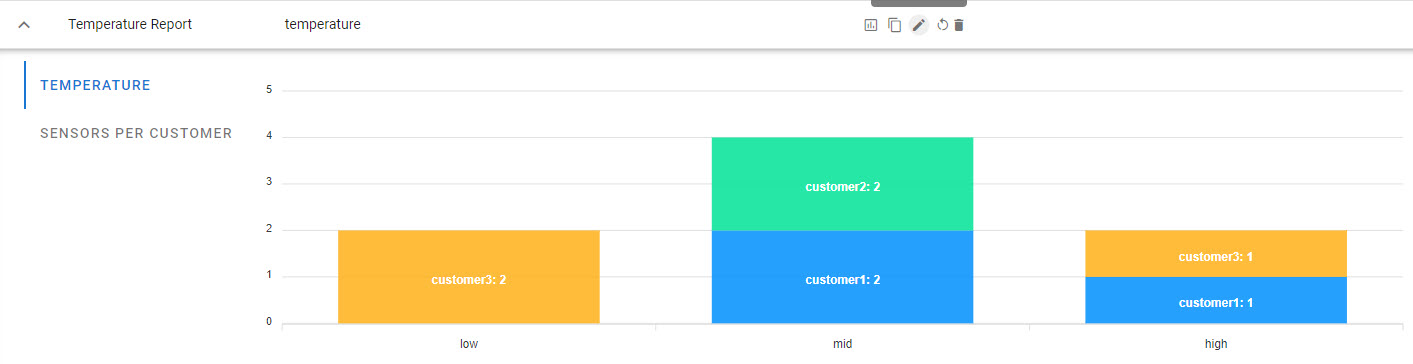
- Lastly, you will see the
Temperature by Customeraggregation with the pivoted data showing the number of devices in each range band grouped by customer.
¶ Summary
This was a simple example of how to build a report, but you can build upon this basic model to create any custom report you may need.